Acceleration
Acceleration is the rate of change of velocity of an object with respect to time.
Activity Mean Maximal
Activity Mean Maximal is the best average power you can hold for a set period of time so for example the best wattage in your current training activity that you held for one minute would be your mean maximal 1 minute power.
Acute Training Load (ATL)
Acute Training Load is the dose of training that you accumulated over a short period of time, computed as an exponentially weighted moving average of the chosen Training Load metric (For example TSS).
Most calculations use 7 days as the default period. It is widely accepted that this relates to your fatigue (or freshness).
(See also Short Term Stress).
Aerobic Decoupling
Aerobic decoupling is when power output and heart rate are no longer parallel in a workout.
Where one variable remains steady while the other drifts, the relationship is said to have "decoupled" (e.g. when power remains constant but heart rate goes up, or when heart rate remains constant and power drops).
Excessive decoupling (much higher than 5%) would indicate a lack of aerobic endurance fitness.
Aerodynamic Drag (CdA)
Aerodynamic drag is the air resistance of a bike and rider. It is a product of an objects drag coefficient (Cd) or "slipperiness" and it's frontal area (A). CdA = Cd x A.
Aerobic metabolism
Aerobic metabolism is the way your body creates ATP, the basic currency of energy, through the conversion of carbohydrates, proteins (amino acids), and fats in the presence of oxygen.
Using the Krebs cycle (Also called as the Tricarboxylic Acid (TCA) cycle, or simply the Citric Acid Cycle), aerobic metabolism is an 8-step process that produces up to 38 ATP compared with just 2 for Anaerobic metabolism.
Aerobic metabolism is used for the sustained production of energy for endurance efforts.
Air density (kg/m3)
Air density is the mass per unit volume of the Earth's atmosphere.
Altitude
Altitude is height above sea level measured by an altimeter (air pressure and density reduces with height above sea level) or using GPS to measure the distance from multiple satellites.
Commercial GPS is not a very accurate way to measure elevation as it is prioritized to measure horizontal distance.
Altitude is typically only used to describe the height of an aircraft in flight.
Altitude Acclimatisation
Altitude Acclimatisation is process that results in the body adapting to lower levels of oxygen at altitude by producing more red blood cells.
It is achieved by spending extended periods of time at various levels of altitude before progressing higher, it can also be achieved using an altitude tent.
Altitude Acclimatisation is important if you are taking place in an event held at an elevation substantially higher than that at which you usually train.
General wisdom suggests that two weeks is a reasonable length of time to gain a noticeable boost in your red blood cell count. Less than that and you probably won’t get a very noticeable or worthwhile boost.
You also have a longer-term window, another couple of weeks, during which the unwinding is happening, though your blood cell count is still enhanced. After that, the benefits are likely to have disappeared.
Altitude Power (aPower)
Altitude Power is your power output adjusted to take into account the likely effect of altitude, for example every 70w at the top of the Col de Galibier is equivalent to 100w at sea level; 70 watts becomes 100 aPower watts.
Anaerobic Metabolism
Anaerobic metabolism is the creation of ATP, the basic currency of energy, through the glycolysis of glucose from carbohydrates in the absence of oxygen. This occurs when your lungs cannot put enough oxygen into the bloodstream to keep up with the demands of your muscles for energy.
Anaerobic metabolism is less efficient than aerobic metabolism and produces just 2 ATP compared with up to 38 ATP for aerobic metabolism
It is generally only used for short bursts of activity, such as sprinting.
When there isn't enough oxygen in the bloodstream, glucose and glycogen cannot be fully broken down to carbon dioxide and water. Instead, lactic acid is produced, which can build up in the muscles and degrade muscle function.
Anaerobic Threshold (AT)
Anaerobic Threshold is the point at which there is a ‘sudden and sustained’ increase in blood lactate concentration.
Accumulation of lactate is associated with the onset of fatigue; therefore the higher the intensity this occurs at, the greater resistance you have to fatigue. This is the highest possible steady-state work intensity that can be maintained for a prolonged period of time (so strongly related to FTP and CP).
Above this intensity you would begin to fatigue more rapidly. Like the lactate threshold, this can be improved with training. An increase in the exercise intensity at which the anaerobic threshold occurs could indicate an improvement in lactate buffering or lactate clearance.
Anaerobic Work Capacity
Anaerobic Work Capacity is a measure of how much anaerobic work (Without Oxygen) your body is able to put in at any given time during the ride.
Ant+
ANT+ is an ultra-low power (ULP) wireless protocol that allows sending information wirelessly between devices either in a one to one or one to many relationship. ANT+ devices use the 2457MHz RF frequency.
Ant+ has a range of up to 100ft (30 meters) and is often used in home trainers.
Automatic Temperature Compensation (ATC)
Area (M²) is the total frontal area presented by the rider and bike. A typical cyclist presents a frontal area of 0.3 to 0.6 meters squared depending on position. Frontal areas of an average cyclist riding in different positions are as follows.
| Tops* |
0.632 |
| Hoods* |
0.40 |
| Drops* |
0.32 |
|
|
Aerodynamic drag: CdA is calculated by multiplying Frontal Area: A by the Coefficient of drag: Cd.
Average Power (AP)
Average power is the average of your power output throughout your whole ride.
AVNN (HRV Metric)
AVNN stands for the average NN interval, and should equal Mean IBI for a segment.
Balance
Balance is the difference in power produced measured for left and right legs.
BikeScore
BikeScore is a quantification of the training session that takes into account the duration and intensity of the training (it's based on the power data).
Bikescore is intended to estimate the training load and physiological stress created by that session. See also TSS and TRIMP.
Blood Lactate
Blood Lactate or simply Lactate is a by-product of carbohydrate metabolism.
When carbohydrate is metabolized, lactic acid is produced in the form of lactate ions and hydrogen ions. The greater the rate that carbohydrate is metabolised for energy, the greater the rate that lactate is produced.
When the rate of production exceeds the rate that it can be cleared (metabolised for further energy production and buffered by bicarbonate), lactate and hydrogen ions will accumulate in the blood and muscles.
The accumulation of hydrogen ions lowers the pH of the blood and muscle (making it more acidic), which inhibits the functioning of the muscle, causing you to not be able to work as hard. Hence lactate is associated with fatigue, without in itself causing fatigue.
Therefore the concentration of lactate in the blood gives an indication of the type of energy metabolism and also training status.
Bluetooth
Bluetooth is a wireless technology standard that is used to exchange data over short distances (less than 30 feet), usually between personal mobile devices.
This means that a Bluetooth-enabled device such as a smartphone is able to communicate with other Bluetooth devices. Bluetooth can only connect one device to one other device, it does not support one to many connections.
Bluetooth Low Energy (Bluetooth LE or BLE)
Bluetooth Low Energy (Bluetooth LE or BLE) (formerly marketed as Bluetooth Smart) is a wireless personal area network technology designed and marketed by the Bluetooth Special Interest Group (Bluetooth SIG) aimed at the healthcare, fitness, beacons, security, and home entertainment industries
Compared to Classic Bluetooth, Bluetooth Low Energy is intended to provide considerably reduced power consumption and cost while maintaining a similar communication range.
Mobile operating systems including iOS, Android, Windows Phone and BlackBerry, as well as macOS, Linux, Windows 8 and Windows 10, natively support Bluetooth Low Energy. The Bluetooth SIG predicts that by 2018 more than 90% of Bluetooth-enabled smartphones will support Bluetooth Low Energy.
Bluetooth Smart
Bluetooth Smart was the original name for Bluetooth LE but is no longer used please see the Bluetooth Low Energy entry.
Cadence
Cadence is the number of crank Revolutions per minute, typically in the range of 60-120 RPM.
Calories
A calorie is the energy needed to raise the temperature of 1 gram of water through 1 °C (now usually defined as 4.1868 joules). When nutritionists talk about calories they usually mean Kilocalories (1000 Calories - Also sometimes called large calorie)
The basic unit of work measured by power meters is the Joule or kiloJoule (1000 Joules) which is approximately equal to 1 Kcal. This makes it very easy to calculate nutrition requirements when cycling with a power meter.
The actual conversation rate is 4.18kJs = 1 kcal, but most people range from 20-25 percent efficiency. This means that for every 100 calories burned in exercise, only around 25 at best propels you forward and are measured at the power meter. The rest is turned into heat. If you know your power output and time, you can calculate calories burned.
Carbohydrate
Carbohydrates (Carbs) are pure fuel. Your body stores them as glycogen in the muscles and liver. Each gram of carbohydrate provides four calories of energy. At any one time you have about 400 to 500 grams or 2,000 calories worth of carbs stored and available to fuel your activity.
Carbs provide fast energy for your muscles because your cells can convert stored glycogen and glucose (blood sugar that is created when your body breaks down the carbs you eat) very quickly. The higher your exercise intensity, the more carbs you burn. Your body also uses some carbohydrates to assist with fat burning during lower-intensity exercise.
You’ll deplete your glycogen stores after two to three hours of continuous low-intensity training or within 30 minutes of very high-intensity training. During long rides, you can maintain your energy levels by taking in 30 to 60 grams (120 to 240 calories) of carbohydrates per hour after the first 90 to 120 minutes.
These foods contain carbohydrates: Dairy, Fruit, Grains, Legumes, Starchy Vegetables, Sugary Sweets.
Cd
Cd or Coefficient of drag represents the “Slipperiness” of the Bike and Rider and is a dimensionless number that relates an objects drag force to its area and speed, it ranges upwards from 0. (An object with a drag coefficient of 0 does not exist on earth).
Teardrops or wing shapes have some of the lowest drag coefficients.
Typical drag coefficients are as follows:
| Shape |
Cd |
| Wing or Teardrop |
0.005 |
| Ball |
0.5 |
| Person stood upright |
1.0 |
| Flat plate face-on to airflow |
1.17 |
| Brick |
2.0 |
| Cyclist (Tops) |
1.15 |
| Cyclist (Hoods) |
1.0 |
| Cyclist (Drops) |
0.88 |
| Cyclist (Aero Bars) |
0.70 |
Chronic Training Load (CTL)
Chronic Training Load is the dose of training you accumulated over a longer period of time, computed as an exponentially weighted moving average of the selected Training Load metric.
Most calculations use 42 days as the default period. It is widely accepted that Chronic Training Load relates to your fitness.
(See also Long Term Stress)
Circumferential pedal velocity (m/s)
Circumferential pedal velocity is a measure of how fast the pedal moves around the circle it makes while pedaling. It is derived from cadence as follows:
CPV = C*CL*2*Pi/60
Where CPV = circumferential pedal velocity (in m/s), C = cadence (in rev/min), CL = crank length (in m), and the constants 2, Pi, and 60 serve to convert the data to the proper units.
While technically muscle shortening velocity or at least joint angular velocity should be used instead of CPV, CPV has been shown to be an excellent predictor of joint angular velocity and, by extension, muscle shortening velocity.
Climb Category
Climb Category in road cycling gives a value to the difficulty of a climb based primarily on it’s length and steepness.
Here are the 4 categories currently in use:
Category 4: Is typically less than 2km long and about 5 percent grade, or up to 5km at a 2-3 percent grade.
Category 3: This can be as short as one mile with a very steep grade, perhaps 10 percent; or as long as six miles with a grade less than 5 percent.
Category 2: Can be as short as 5km at 8 percent, or as long as 15km at 4 percent.
Category 1: Once the highest category, can be anything from 8km at 8 percent to 20km at 5 percent.
hors catégorie (“above category”): This rating is given to exceptionally tough climbs. This could either be a Category 1 whose summit is also the finish of the stage, or one that is more than 10km long with an average grade of at least 7.5 percent, or up to 25km miles long at 6 percent or steeper."
Coefficient of Drag (Cd)
Coefficient of drag represents the “Slipperiness” of the Bike and Rider and is a dimensionless number that relates an objects drag force to its area and speed, it ranges upwards from 0. (An object with a drag coefficient of 0 does not exist on earth). Teardrops or wing shapes have some of the lowest drag coefficients.
Typical drag coefficients are as follows:
| Shape |
Cd |
| Wing or Teardrop |
0.005 |
| Ball |
0.5 |
| Person stood upright |
1.0 |
| Flat plate face-on to airflow |
1.17 |
| Brick |
2.0 |
| Cyclist (Tops) |
1.15 |
| Cyclist (Hoods) |
1.0 |
| Cyclist (Drops) |
0.88 |
| Cyclist (Aero Bars) |
0.70 |
Coefficient of Rolling Resistance (Crr)
Coefficient of Rolling Resistance is the force needed to push (or tow) a wheeled vehicle forward (at constant speed on a level surface, or zero grade, with zero air resistance) per unit force of weight.
Hysteresis is the main cause of energy loss associated with rolling resistance and is attributed to the viscoelastic characteristics of the rubber.
The rubber compound in a bicycle tire exhibits hysteresis. As the tire rotates under the weight of the bike, it experiences repeated cycles of deformation and recovery, and it dissipates the hysteresis energy loss as heat.
The Coefficient of Rolling Resistance is determined by tyre contact patch area, Compound Stickiness, Rider and Bike weight and road surface.
Here are a few sample values:
| 0.001 |
bicycle tire on wooden track |
| 0.002 |
bicycle tire on concrete |
| 0.004 |
bicycle tire on asphalt road |
| 0.008 |
bicycle tire on rough paved road |
Core temperature (CT)
Core body temperature refers to the temperature of the internal environment of the body. This includes organs such as the heart and liver, and the blood the ideal core temperature in humans is 37°C.
Core temperature in combination with heart rate (HR) can be a good indicator of impending heat exhaustion as a result of high temperatures and heavy workloads.
Crank length
Crank length, the two cranks, one on each side and usually mounted 180° apart, connect the bottom bracket axle to the pedals There length is measured from the centre of the bottom bracket axle to the centre of the pedal axle.
Most stock bikes have cranks of 170mm or 175mm, but you can get them as short as 140mm and as long as 190mm.
Critical Mean Maximal (CMM)
Critical Mean Maximal (also known as Mean Maximal Power (MMP) looks at the most power you have ever averaged for each given amount of time. It scans through all the training files you specify, finding your best ever one-second power, two-second power, and so on all the way out to your longest ride.
This functionality is available in many power analysis programs, including Training Peaks, WKO, and Golden Cheetah.
Critical Power
Critical Power is the power an athlete can sustain for a very long time, without fatigue, in theory. It is calculated using a model and time to exhaustion tests of 2 and 12 or 20 minutes (see also FTP)
In practice, CP and FTP are usually close to each other. But since it is very difficult for an athlete to maintain the desired intensity FTP 'reality' tends to result in a number that is much lower than CP 'theory'. Often users will consider the two as the same.
Cycling Efficiency (CE)
Cycling efficiency is a measure of effective work and is most commonly expressed as a percentage of total energy expended to produce work. The efficiency of the human body is in the range of 10–25%.
In cycling we assume a CE value of 25%.
Cycling Power Meter
A cycling power meter is a device on a bicycle that measures the power output of the rider. Most cycling power meters use strain gauges to measure torque applied, and when combined with angular velocity, calculate power.
Daniels Points
Daniels Points is a point system for tracking training stress in runners, similar to TSS/BikeScore, in that faster running counts more than slower running.
Since there aren't power meters in running Daniels bases the system off fractions of a runner's pace at VO2Max.
Drafting
Drafting is a technique where two or more cyclists ride in a close group reducing the overall effect of drag by exploiting the lead cyclists slipstream.
The optimum drafting position is as close behind the leader’s rear wheel as possible, or if there’s a crosswind, slightly overlapping (echelon) can also be helpful.
The lead cyclist also benefits from drafting as the area of negative air pressure behind them (which causes drag) is reduced by the following cyclist.
Drafting reduces air resistance, the primary force opposing cyclists, and reduces energy utilisation by as much as 40%. Furthermore, it has been demonstrated while drafting a cyclist outdoors at 39.5 km/ hour compared with cycling alone results in reductions of ~14% for ˙VO2, 7.5% in HR, and ~31% for expiratory volume (VE).
Elevation
Elevation is height above sea level measured by an altimeter (air pressure and density reduces with height above sea level) or using GPS to measure the distance from multiple satellites.
Commercial GPS is not a very accurate way to measure elevation as it is prioritized to measure horizontal distance.
Elevation is usually used to describe the height of the ground, or a feature fixed to the ground.
Fast Twitch Skeletal Muscle (Type IIB)
Characteristics of Fast Twitch Skeletal Muscle (Type IIB)
- Used for Sprinting
- large in diameter
- use enormous reserves of glycogen rather than oxygen-rich blood for quick energy
- densely packed myofibrils
- few mitochondria
- generate a lot of tension
- rely largely on anaerobic metabolism
- fatigue rapidly
Fast Twitch/ Intermediate Twitch Skeletal Muscle (Type IIA)
Characteristics of Fast Twitch/ Intermediate Twitch Skeletal Muscle (Type IIA)
- have properties of both fast and slow twitch fibers
- similar in appearance to fast twitch fibers
- similar in endurance to slow twitch fibers
Fat
Fat provides your body with fuel and insulation. Each gram of fat delivers nine calories of energy. Even lean people have enough stored fat to provide hours of energy. It’s stored all over your body beneath the skin as well as in muscle tissue.
Your muscles burn fat for fuel during aerobic exercise. You need lots of oxygen to make energy with fat, so it’s your body’s preferred source during lower-intensity exercise. Fat also provides insulation, protects your organs, and helps you absorb essential fat-soluble vitamins like A, E, and D.
It is recommended that endurance athletes aim for about 30 percent of their calories from fat, which you can easily get by eating a balanced, healthy diet.
These foods contain fats: Red meat, Skin-on chicken and other poultry, Whole-milk dairy, Oily Fish, Avocado, Some Nuts, Margarine, Palm and Coconut oil, Cakes, Pies, Biscuits, French Fries
Fatigue
Fatigue (Also known as freshness, Acute Training Load, or ATL). By taking an exponentially weighted average of that stress from the past 7 days we are able to calculate your Fatigue, or an estimate of your fatigue accounting for the workouts you have done in the past two weeks.
Here you can see on days with a workout with a high training stress score the Fatigue climbs sharply in response. You do a hard workout today and you will feel it in the coming days.
Fitness (See also CTL)
Fitness in cycling is defined as an accumulation of training
Fitness is an exponentially weighted average of the last 42 days of training and reflects the training you have done over the last 3 months.
The workouts you did 15 days ago will impact your fitness more than the workouts you did 6 weeks ago. You may notice that as Fitness goes up so does Fatigue, only at a greater rate.
The Performance Management Chart tells the story of your fitness, consistent training is marked by a steady rise in Fatigue and Fitness whereas a sharp drop might indicate time off due to sickness or injury.
Form (See also TSB)
Form represents the balance of training stress as shown by the Training Stress Balance (TSB)
Form (TSB)
Form = Yesterday's Fitness (CTL) - Yesterday's Fatigue (ATL)
A positive TSB number means that you would have a good chance of performing well during those 'positive' days, and would suggest that you are both fit and fresh.
Frontal Area (M²)
Frontal area is the total frontal area presented by the rider and bike. A typical cyclist presents a frontal area of 0.3 to 0.6 meters squared depending on position. Frontal areas of an average cyclist riding in different positions are as follows.
| Tops |
0.632 |
| Hoods |
0.40 |
| Drops |
0.32 |
Aerodynamic drag: CdA is calculated by multiplying Frontal Area: A by the Coefficient of drag: Cd.
Functional Threshold Power (FTP)
Functional Threshold Power is defined as the greatest Mean Maximal Power (MMP) you can currently produce for one hour.
You can estimate FTP with from your best recent 20-minute power value (either from a dedicated 20-minute test or a sufficiently hard 20-minute effort from a race or workout). Multiply that value by 95% to get your FTP.
Generally FTP is lower than Critical Power (CP) but most users consider them to be the same.
Gear Ratio
Gear Ratio is the Ratio between the number of teeth on the front ring divided by the number of teeth on the rear cog.
Grade
Grade is the Rise over the run, or the amount of vertical elevation divided by the horizontal distance expressed as a percentage.
Heart Rate Threshold
Heart Rate Threshold also known as Threshold Heart Rate is the average heart rate from a recent intense race or very hard interval from a training ride, where you spent 45-60 minutes in duration at an all-out effort.
It is often suggested you can estimate your Heart Rate Threshold by deducting your age from fixed value (often 220) but this is NOT recommended.
Heart Rate Variability (HRV)
Heart rate variability is a well-understood phenomenon allowing us to monitor objectively physiological stress, recovery and ability to perform.
As the body tries to maintain balance so that it can function optimally, heart rhythm is influenced by a series of processes going from the brain to the heart, processes that reflect the level of stress on the body.
Each beat of our heart is triggered by an electrical impulse that can be easily recorded by an electrocardiogram (ECG), one of the most common ways to monitor heart activity. However, our heart doesn't beat at a constant frequency. When we talk about heart rate variability (HRV), we are interested in capturing the variability that occurs between heart beats.
HRV can be measured non-invasively with a chest heart rate monitor, a finger monitor and many other wearable devices such as sports watches.
HRV Recovery Points
HRV Recovery Points provide a single, straightforward metric to analyze your physical condition.
They are based on the single most used metric to quantify recovery based on HRV, which is rMSSD.
HRV Recovery Points adapt the score based on your anthropometrics. HRV Recovery Points are used to compute your baseline and provide guidance on training schedules.
IBI Series (HRV Metric)
IBI series. If HRV is the study of variability in beat to beat timing, then the first step is to measure the timing between beats. That time is referred to as the Interbeat Interval (IBI).
It is also sometimes known as the heart period.
Intensity Factor (IF)
Intensity Factor offers a way of comparing the relative intensity of a training session or race within or between riders, taking into account changes or differences in threshold power.
Intensity Factor is calculated by dividing Normalized power by FTP. (See also Relative Intensity).
Lactate Threshold (LT)
Lactate Threshold is the point in exercise where lactate first begins to accumulate in the blood.
LT is used as a measure of your training status. Ideally this will occur at a relatively high workload that would indicate a well-developed aerobic base.
An adaptation to training which results in an improvement in base aerobic condition will be reflected by your lactate threshold occurring at a higher work load.
Lactate Threshold Heart Rate (LTHR)
The LTHR is the point, above which, increased blood acidification occurs in your body. Crossing this threshold will make your endurance performance rapidly decrease. In a race, you might maintain that level for up to an hour, but at a certain point you will slow down. When the lactate clears from your system you can pick up the pace again
If you were to do a sustained, maximal, one-hour effort your average heart rate during that effort is your LTHR.
Long Term Stress
Long Term Stress is the dose of training you accumulated over a longer period of time, computed as an exponentially weighted moving average of the selected Training Load metric.
Most calculations use 42 days as the default period. It is widely accepted that this relate to your fitness.
See also Chronic Training Load (CTL).
Mass
Mass is both a property of a physical body and a measure of its resistance to acceleration (a change in its state of motion) when a net force is applied.
An object's mass also determines the strength of its gravitational attraction to other bodies.
The basic SI unit of mass is the kilogram (kg). In physics, mass is not the same as weight, even though mass is often determined by measuring the object's weight using a spring scale, rather than balance scale comparing it directly with known masses.
An object on the Moon would weigh less than it does on Earth because of the lower gravity, but it would still have the same mass. This is because weight is a force, while mass is the property that (along with gravity) determines the strength of this force.
Match
A “match” is an elusive term used by riders, and coaches within the bike racing world. When you burn a match, you have done a hard effort. It’s an effort that in which you had to dig deep, or you had to really push yourself.
Any bike racer knows what it feels like to have burned a match
Why do you need to know what a match is? Well, you as a rider, start out the day with a full set of matches in your matchbook, but every time you go hard, do an attack, have to hammer over a hill, you burn one of your matches.
All of us have different size matchbooks, but nobody has an infinite number, so it’s important to burn your matches at the right time during a race or in training. Otherwise you are left with an empty matchbook and then your chances of performing well have been drastically reduced.
Burn all your matches before the end of the race and it’s unlikely that you’ll win.
Maximal Aerobic Power (MAP)
A MAP test (Maximum Aerobic Power) also known as a Ramp Test is performed by riding at increasingly harder efforts to exhaustion. MAP tests are usually carried out in lab conditions.
There are a few different protocols, but it would typically start at about 250 watts and increase 50 watts every 2 or 3 minutes until failure.
The wattage that you complete the at last step of 2 or 3 minutes is your MAP result.
Maximal Lactate Steady State (MaxLass or MLSS)
Maximal Lactate Steady State is an effort level that an athlete can continue at for an extended period of time without having to slow down, MLSS can be as much as an hour or possibly longer.
As long as the athlete maintains this effort level, their lactate level will remain constant. At any effort levels above this point the athlete's lactate level will rise, and they will be forced to stop.
Also known as Lactate Threshold, or the Anaerobic Threshold.
Mean Maximal Power (MMP)
Mean Maximal Power looks at the most power you have ever averaged for each given amount of time. It scans through all the training files you specify, finding your best ever one-second power, two-second power, and so on all the way out to your longest ride.
This functionality is available in many power analysis programs, including Training Peaks, WKO, and Golden Cheetah.
See also Critical Mean Maximal (CMM).
Mitochondria
Mitochondria produce energy for cells through respiration. They produce adenosine triphosphate (ATP) through a process called the Krebs Cycle or the Citric Acid Cycle by oxidation of substances formed in the cytosol of the cell.
Muscle Oxygenation
Muscle Oxygenation is a measurement of how much hemoglobin is carrying oxygen in the capillaries of the muscle. It is expressed as a percentage from 0 to 100 and is often abbreviated as SmO2.
Muscle Oxygenation is a localized measurement that depends on the exertion level, blood flow, and relative changes in the hemoglobin dissociation curve. It is measured optically with near-infrared light, so it is completely non-invasive.
The different absorption spectra of the infrared light passing through the muscular tissue can identify the relative amount of hemoglobin that is carrying oxygen compared to the amount that is not.
Moxy and Humon are leading providers of Muscle Oxygenation monitors.
Muscle Recruitment
Muscle Recruitment refers to the number of muscle fibers that are actually being engaged within a muscle contraction.
For illustration purposes, consider the following example: if a muscle contains 1000 muscle fibers and 500 of them are being engaged, then there is 50% muscle recruitment, but this does not indicate anything about the degree of activation.
The force generated by the individual recruited muscle fibers is how we would define activation, or their ability to contract and generate a given force.
Ideally there would always be 100% muscle recruitment and 100% muscle activation, but in most cases this simply doesn’t happen.
Myofibrils
Myofibrils are fine longitudinal fibrils occurring in a skeletal or cardiac muscle fiber and consisting of many regularly overlapped ultramicroscopic thick and thin myofilaments.
Myofibrils give a muscle its ability to contract and so having more or stronger myofibrils is better, they can be strengthened by damaging them with hard exercise and then letting them heal.
NN Interval (HRV Metric)
NN interval is the same as RR interval, or the time interval between heartbeat (R) peaks. The letter N is used to distinguish that these statistics are intended to derive from “normal” RR intervals, or RR intervals which represent normal cardiac timing and are free from artifact.
NN50/ pNN50 (HRV Metric)
NN50 and pNN50 have been shown to be representative of changes in high frequency HRV. NN50 represents the number of NN intervals which differ by more than 50 milliseconds from the previous interval, and pNN50 is the proportion of these intervals relative to the total time segment.
Normal Force
Normal Force is the force that surfaces exert to prevent solid objects from passing through each other.
Normal force is a contact force. If two surfaces are not in contact, they can't exert a normal force on each other. For example, the surfaces of a table and a box cannot exert normal forces on each other if they are not in contact.
However, when two surfaces are in contact (e.g. a box and a table) they exert a normal force on each other, perpendicular to the contacting surfaces. This normal force will be as large as necessary to prevent the surfaces from penetrating each other.
Normalized Power (NP)
Normalized Power is a power averaging method, measured in watts, that compensates for changes in ride conditions for a more accurate depiction of power expenditure than average power.
Normalized power takes into account the additional stress caused by hills and peaks as well as intervals when compared with a flat ride of the same duration even though the average power would be the same for both rides.
In general, Normal Power is not valid for shorter efforts; in these cases average power should be used instead.
Pace Zone
Pace Zone allows for the definition of Zones for additional sports like Swimming and Running in Golden Cheetah. Zones are calculated based on Critical Velocity in km/hr.
Peak
Peak/Peaking means you are arriving on race day mentally and physically prepared to be able to deliver your strongest possible performance. The art of peaking requires smart, creative scheduling for a proper taper.
The most common mistakes athletes make regarding taper are:
- Too much or too little intensity
- Too much volume
- Not enough recovery
Other factors that can negatively affect performance include the quality of rest, levels of life stress, travel logistics and diet.
Peak Power (Pmax)
Peak Power is the maximal power produced over one full rotation of the cranks.
Peak Power Phase
Peak Power Phase is the angular range where you are producing a specified fraction of the total power for a crank rotation.
It is reported for both the left and right sides using a start and end angle. In Garmin devices for example by default the fraction is set to 50%.
Pedal Center Offset (PCO)
The Pedal Center Offset measurement is calculated by identifying how force is distributed across the pedal platform during the pedal stroke.
That means you can view and evaluate where force is applied relative to the center of the pedal platform and what the PCO distribution is over a given period of time.
Analyzing this data can help you determine proper bike fit and cleat position. It may also be helpful in preventing injury and rehabilitation.
PCO is also known as Platform Center Offset
Pedal Force
Pedal Force is the Force applied to the pedal.
At the moment no power meter directly measures the force(s) applied to the pedal. It is possible to derive the average (i.e., over 360º) effective (i.e., tangential to the crank) pedal force (both legs combined) from power and cadence data as follows:
AEPF = (P*60)/(C*2*Pi*CL)
Where AEPF = average effective pedal force (in N), C = cadence (in rev/min), CL = crank length (in m), and the constants 60, 2, and Pi serve to convert cadence to angular velocity (in rad/s).
Pedal Smoothness
Pedal smoothness measures how smoothly power is delivered to the pedal throughout the revolution. It is calculated as Pavg / Pmax and is normally displayed as a percentage. A value of 100% means that the power is delivered constantly throughout the revolution. Values of 10–40% are common.
Pedal Stack Height.
Pedal Stack height is the distance from the center of pedal spindle to bottom surface of shoe.
Lower stack height means that your power is applied more directly to the pedal with less effort required to control pedal position, in the real world it is unlikely to make much difference.
Performance Management Chart (PMC)
Performance Management Chart is a chart showing the relationship over time of CTL, ATL,TSB and TSS. The PMC is used to taper training to arrive at an event in peak condition.
Performance Management Chart (Skiba)
Performance Management Chart (Skiba) is a PMC based on Bikescore.
Performance Management Chart (TRIMP)
Performance Management Chart (TRIMP) is a PMC based on TRIMP Points.
Performance Management Chart (TriScore)
Performance Management Chart (TriScore) is a PMC based on TriScore : a combined stress score computed according to sport: BikeScore for cycling, GOVSS for running and SwimScore for swimming.
Phosphocreatine System(ATP-PC)
Phosphocreatine System(ATP-PC) also known as the anaerobic alactic system is used during the first 10 seconds of sustained muscle contraction. It is anaerobic because it doesn't require oxygen to function and alactic because it doesn't produce lactic acid.
To make ATP, phosphocreatine transfers a phosphate molecule to ADP. The newly-formed ATP is now available to be used for muscle contraction. The leftover portion is creatine, which is processed by the liver into creatinine and eliminated through the kidneys and urine. The body doesn't recycle this creatine into phosphocreatine
Muscle fatigue is noticeable by the end of the phosphocreatine cycle. After 10 seconds of muscle contraction, the muscles are able to use anaerobic glycolysis and aerobic glycolysis pathways to provide energy. Phosphocreatine is regenerated by the liver, pancreas, and kidneys.
Fast-twitch skeletal muscles store more phosphocreatine to have available for short periods of intense muscle contraction. The slow-twitch skeletal muscles and heart store less.
Power (Watts)
Power is the rate at which energy is produced (energy over time) and is measured in watts. One watt is equivalent to one joule per second. In cycling, energy is expressed in terms of work (such as how hard you have to work to ascend a climb).
Power Phase
Power Phase is the period in the crank rotation when you are producing power (positive torque). It is reported for both the left and right sides using a start and end angle.
Power to weight ratio (Watts/Kg)
Power to weight ratio is a key metric for cyclists and is FTP/CP divided by the riders weight in Kg.
Power Zones
Power Zones are used to give an athlete a set intensity at which they should be working to during an activity. They may, for example, be required to complete intervals at ‘zone 4’ for 10 minutes.
Training using zones is important because it means that riders can be sure they’re pushing hard enough during intervals and that they’re pedaling easily enough on recovery and endurance rides.
Here is a list of commonly used Power Zones
- Z1 Active Recovery
- Z2 Endurance
- Z3 Tempo
- Z4 Threshold (CP or FTP)
- Z5 Vo2max
- Z6 Anaerobic
- Z7 Neuromuscular
Protein
Proteins are the building materials of your body. Your body uses small amounts of protein to make glucose during long training runs (over two hours). Each gram of protein provides four calories of energy.
Protein helps build and repair muscle and other body tissues. It also plays a key role in hormone production and immune function, as well as being a source of ATP.
Endurance athletes need upwards of one gram of protein per pound of body weight.
These foods contain proteins: Eggs, Seafood, White-Meat Poultry, Milk, Cheese, Yogurt, Beans, Pork, Soy, Lean Beef, Oats, Broccoli, Cottage Cheese, Lentils, and Peanuts.
Q Factor
Q Factor Is the distance between the outside of one crank arm to the outside of the opposite crank arm. This affects how far apart your feet and legs are when cycling.
It’s important to note the spindle length when buying a new set of pedals. Spindle length is measured from the center of the pedal body to where the pedal spindle meets the crank arm.
For road pedals, spindle lengths in the mid- to high-50 mms are common
You will see Spindle length being referred to as Q Factor in many power meter pedal specifications. We refer to spindle length as Q Factor in our comparison chart.
Quadrant Analysis (QA)
Quadrant Analysis tells you how you created your power, since the same number of watts can be created by different combinations of force and pedal velocity.
It helps to give you an understanding of the muscular and cardiovascular demands created by each ride. It can also help you determine if in training you are creating wattage in the same quadrants that you would in a race and adjust your training as necessary.
The four quadrants represent the following combinations of force and pedal velocity.
Quadrant 1 (upper right): high force and high cadence.
Quadrant 2 (upper left): high force and low cadence.
Quadrant 3 (lower left): low force and low cadence.
Quadrant 4 (lower right): low force and high cadence.
Ramp Rate (RR)
Ramp Rate is the rate at which Chronic Training Load (CTL)/Long Term Stress (LTS) increases over a given time period. Large values up and down indicate a risk of injury and aggressive taper respectively.
Rate of Perceived Exertion (RPE)
Rate of Perceived Exertion is very useful metric because it is a subjective measure of "rider feeling" of an effort. Measuring RPE involves rating your training from Very Very Light to Very Very Hard.
When considering how hard you felt the session was it is important to consider feelings such as shortness of breath, as well as how tired you feel in your legs and overall.
Dr. Gunnar Borg, who created the scale, set it to run from 6 to 20 as a simple way to estimate heart rate—multiplying the Borg score by 10 gives an approximate heart rate for a particular level of activity.
| w you might describe your exertion |
Borg rating of your exertion |
Examples
(for most adults <65 years old) |
| None |
6 |
Reading a book, watching television |
| Very, very light |
7 to 8 |
Tying shoes |
| Very light |
9 to 10 |
Chores like folding clothes that seem to take little effort |
| Fairly light |
11 to 12 |
Walking through the grocery store or other activities that require some effort but not enough to speed up your breathing |
| Somewhat hard |
13 to 14 |
Brisk walking or other activities that require moderate effort and speed your heart rate and breathing but don’t make you out of breath |
| Hard |
15 to 16 |
Bicycling, swimming, or other activities that take vigorous effort and get the heart pounding and make breathing very fast |
| Very hard |
17 to 18 |
The highest level of activity you can sustain |
| Very, very hard |
19 to 20 |
A finishing kick in a race or other burst of activity that you can’t maintain for long |
There are many similar scales including the Borg CR10 Scale which has values between 1 and 10 and you can use these in combination with a Heart rate monitor to monitor issues such as overtraining
For example if Heart Rate training load is stable and RPE training load is going up this means you feel more fatigue with same internal load (or at the same HR you felt more fatigued).
Here’s a useful link to the Borg Scale
Relative Intensity
Relative Intensity is the ratio between xPower and the Critical Power (CP) configured in Power Zones, similar to IF (Intensity Factor).
This is how your xPower relates to your FTP/CP. When xPower = FTP, the intensity is 1.
Rest HR
Rest HR is the average Heart Rate measured at rest (Beats Per Minute).
rMSSD (HRV Metric)
rMSSD is the root mean square of successive differences. It is calculated by taking the RMS of differences between successive N-N intervals. This is a commonly used statistic as it has been shown to correlate highly with high frequency HRV.
Rolling Resistance
Rolling resistance is the energy that is lost when the tire is rolling. The main reason for the loss of energy is the constant deformation of the tire. Pressure; diameter, width, construction type and tread pattern all have an effect on rolling resistance.
Wider tyres (for example 25mm rather than 23mm) tend to have lower rolling resistance however narrow tires have an advantage over wider tires at higher speeds, as they provide less air resistance.
A bicycle with narrow tires is much easier to accelerate, because the rotating mass of the wheels is lower and the bicycle is much more agile.
The importance of this aspect becomes clear very quickly, when you ride in a fast group of cyclists and when you have to accelerate rapidly from 20 to 40 km/h after a sharp turn in order to keep up with the others.
Professional road racers are tending to ride wider tires more and more. Instead of the current standard width of 23 mm, the professional road racers choose more and more tires with widths of 24 or 25 mm.
RPE Scale
The RPE Scale is one of the most widely used methods used to measure ride effort requires the person performing the physical work to answer a question about perceived effort.
Gunnar Borg was a psychophysiologist studying the effects of physical work and devised a scale that had verbal expressions allowing someone to point to a number between 6 and 20 that represented the total pain or effort they were perceiving.
He later invented the CR10 scale which is still in widespread use today, especially in clinical & lab tests, and in speed & power sports. There is a variation, introduced by Dr Carl Foster that multiplies the effort rating by time to get a ‘Session RPE’
RR Interval (HRV Metric)
RR intervals are the small changes (milliseconds) in the intervals between successive heartbeats.
This is different from heart rate, which just averages the number of beats per minute.
SDNN (HRV Metric)
SDNN stands for standard deviation of NN intervals, and is calculated by simply taking the standard deviation of the IBI series. It is typically used as a representation of total variability of a segment.
Short Term Stress
Short Term Stress is the dose of training that you accumulated over a short period of time, computed as an exponentially weighted moving average of the selected Training Load metric. Most calculations use 7 days as the default period. It is widely accepted that this relate to your fatigue (or freshness).
See also Acute Training Load (ATL).
Skeletal Muscles
Skeletal muscles connect bone to bone with tendonous attachments. When they contract, the bones generally pull closer together or flex which creates movement such as pedaling in cyclists.
Skeletal muscles are activated through electrical impulses from motor nerves. This activation triggers a chemical reaction causing muscle fibers to contract. The more muscle fibers that contract, the more powerful the muscle contraction.
Since muscles can only provide movement through contraction, they generally operate in pairs. One muscle acts in opposition to the another muscle. When one muscle contracts, the opposing muscle must relax
Skeletal muscle is controlled by the somatic nervous system (SNS). It is considered voluntary muscle since it is under our conscious control, especially when first learning specific tasks such as riding a bicycle.
Normally the muscles act together in a coordinated manner, producing smooth, efficient movements.
There are two basic categories of skeletal muscle – fast twitch (also referred to as fast glycolic or Type IIB) and slow twitch (slow oxidative or Type I). Within the fast twitch there is a second category sometimes referred to as intermediate, Type IIA, or fast oxidative fibers. Each has their own set of characteristics and purpose.
The percentage of fast, slow and intermediate twitch muscle fibers varies from person to person. The proportion is determined by genetics but can change with physical conditioning. Certain hormones, such as human growth hormone (HGH), testosterone and thyroid hormones can also stimulate the metabolism and size of muscle fibers.
Slow Twitch Skeletal Muscle (Type I)
Characteristics of Slow Twitch Skeletal Muscle (Type I)
- Needed for Endurance
- Smaller than fast twitch muscles
- Take about three times longer to contract after receiving stimulus
- many mitochondria
- contain a large amount of myoglobin, which carry oxygen to muscle fibers (similar to hemoglobin, which helps carry oxygen to blood)
- slow twitch fibers are needed for posture and movement, and in back muscles and muscles of the legs
- because it needs high levels of blood and oxygen these fibers may receive the most benefit from massage
Sprint
To sprint is to achieve your maximum speed over a short distance.
Stance
Stance is measured from the center of one pedal body across to the other. Therefore, the length of the pedal spindle affects your stance.
The longer the pedal’s spindle, the wider your stance, because it will place your pedals further from the bike’s center-line – and vice versa for shorter pedal spindles.
It’s important to note the spindle length when buying a new set of pedals. Spindle length is measured from the center of the pedal body to where the pedal spindle meets the crank arm. For road pedals, spindle lengths in the mid- to high-50 mms are common.
You will see Spindle length being referred to as Q Factor in many power meter pedal specifications. We refer to spindle length as Q Factor in our comparison chart.
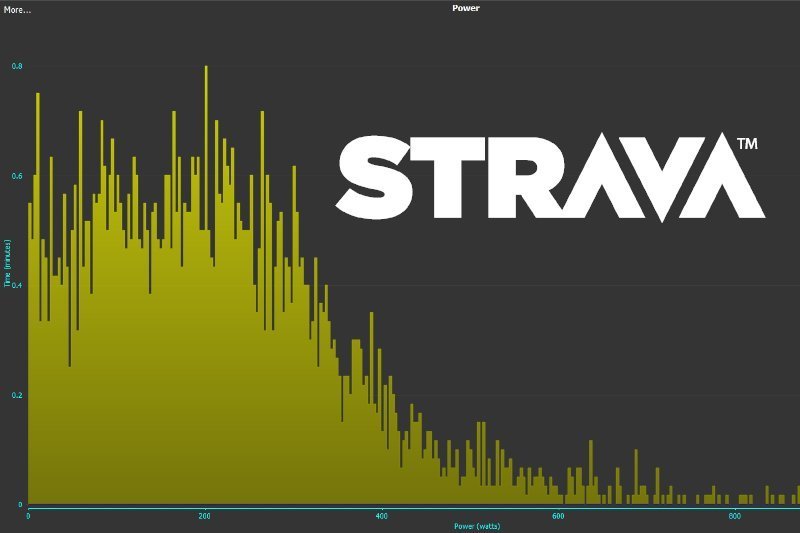
Suffer Score (Strava)
Suffer Score is a Starva metric inspired by Eric Banister’s training-impulse (TRIMP) concept.
It is derived from the amount of time spent in each heart rate zone, so it can be calculated for multiple sports.
You can set your Strava heart rate zones in your personal settings, or just leave then on default, based on your maximum heart rate.
Tapering
Tapering refers to the practice of gradually reducing training in the days running up to an important competition. (See also Form) Tapering is widely used in many endurance sports, such as cycling running and swimming.
For many athletes, a significant period of tapering is essential for optimal performance. The tapering period usually lasts for 7 days or more and may include stopping training completely in the last few days.
Tau
Tau is a measure of your rate of replenishing your W' stores.
Torque Effectiveness (TE)
Torque Effectiveness refers to how much you are pushing in the down part of the pedal stroke (P+) vs. the up part of the stroke (un weighting P-). 60-100% are common with 100% being good or all power was used to push the pedal in a positive direction.
Training Impact Scoring System (TISS)
Training Impact Scoring System is a metric to quantify training strain or response. This is as opposed to the training load/stress (like TSS and TRIMP).
Training Stress Balance (TSB)
Training Stress Balance/Stress Balance (see also Form) represents the balance of training stress.
It is the result of subtracting yesterday’s Acute Training Load/Shor Term Stress (“fatigue”) from yesterday’s Chronic Training Load/Long Term Stress (“fitness”).
In general terms, if it's negative, you're fatigued, and if it's positive you're fresh.
It is claimed to relate to your form or freshness.
Training Stress Score (TSS)
Training Stress Score is a way of measuring how much stress is put on the body from a ride. TSS® is calculated using Normalized Power® (NP), Intensity Factor® (IF) and ride duration. TSS® helps to determine the best combination of workouts and rest periods.
TSS® Guide
- Below 150 - recovery for ride will likely be finished by the next day (low)
- 150 to 300 - may be some leftover tiredness the next day, but gone by 2nd day (medium)
- 300 to 450 - may be some tiredness Even after two days (high)
- More than 450 - Likely be tired for several days after ride (very high)
Measuring the physical stress a ride has had will help improve the overall race performance and help make improvements to a training regimen.
TRIMP
TRIMP was developed by Banister (1991) as the ‘training impulse’, a method to quantify training load.
Banisters TRIMP takes into consideration the intensity of exercise as calculated by the heart rate (HR) reserve method and the duration of exercise.
The mean HR for the training session is weighted according to the relationship between HR and blood lactate as observed during incremental exercise and then multiplied by the session duration.
TRIMP is calculated using the formula below:
time (mins) x ∆HR x y
Where;
t = duration (mins)
∆HR = fractional elevation in HR or HR reserve
y = weighting factor
(Strava's Suffer Score is a modified TRIMP score)
TRIMP (100) Points
TRIMP (100) Points are same as TRIMP Points but scaled so 1 hour at Lactate Threshold Heart Rate gives 100 points to "align" it with TSS/BikeScore.
TRIMP Points
TRIMP Points are the original Morton/Banister with Green et al coefficient.
TRIMP Zonal Points
TRIMP Zonal Points points are accumulated according to time in zone weighted by a zone coefficient, which is defined in HR Zones:
Variability Index (VI)
Variability Index is Normalized Power divided by Average Power.
The closer your Variability Index is to 1.0, or the more similar your Normalized Power and Average Power, the "smoother" your power output was (equivalent to riding on a flat road with no wind).
VO2max
VO2max is the maximum volume of oxygen that you are able to utilize. It is used as an indicator of endurance performance potential, although the lactate and anaerobic thresholds are more relevant predictors of your current performance capacity.
VO2max is largely determined by genetics.
W’ Expended (%)
W' Expended is the maximum W’bal expended as a percentage of W’.
W’ Bal (W’ Balance)
W’ Balance is a fixed amount of work, expressed in kJ, that you can do above Critical Power.
Another way to look at it is to consider it as the amount of anaerobic work your body is able to put in at any given time during the ride.
W’ Bal is also known as the Anaerobic Work Capacity. ie how much anaerobic work your body is able to put in at any given time during the ride.
See also W’ and Aerobic Work Capacity.
W’ Bal Zones
A W-Bal Zone is used to represent your level of Fatigue based on your W’Bal
- W1 Recovered
- W2 Moderate Fatigue
- W3 Heavy Fatigue
- W4 Severe Fatigue
W’ Prime (W’)
W’ Prime is a fixed amount of work, expressed in kJ, that you can do above Critical Power.
W’ Work (kJ)
W’ Work is the amount of kJ produced while power is above CP.
Weight
Weight is the force exerted on the mass of a body by a gravitational field resulting in the heaviness of a person or thing.
Work (kJ)
Work is force applied over distance.
Examples of work include lifting an object against the Earth's gravitation, driving a car up a hill, and pulling down a captive helium balloon.
Work is a mechanical manifestation of energy and is usually expressed as a KiloJoule (1000 Joules).
The standard unit of work is the joule (J), equivalent to a Newton - meter (N · m). This reduces to one kilogram-meter squared per second squared (kg · m 2 /s 2 or kg · m 2 · s -2 ) in base International System of Units (SI) units.
xPower
xPower is a power averaging method, measured in watts, that compensates for changes in ride conditions for a more accurate depiction of power expenditure than average power.
XPower is similar to Normalized Power except that it uses exponential smoothing instead of a moving average, which leads to slight numerical differences in some cases.
In practice though, Normalized Power and xPower are largely the same.
Yaw
Yaw describes the idea that airflow doesn’t always hit a rider head on or at "0 degrees yaw", rather at some other "yaw angle" influenced by the direction of the wind.
Zones
Zones are used to give an athlete a well defined training intensity at which they should be working to during an activity. They may, for example, be completing intervals at ‘zone 3’ for 20 minutes.
Training using zones is important because it means that riders can be sure they’re pushing hard enough during intervals, that they’re racing at a sustainable output for the duration required, and that they’re pedaling gently enough on recovery and endurance rides.
Zones can be based on Power, Heart rate or Pace (For runners).

Leave A Comment
You must be logged in to post a comment.