
If you want to test out how aerodynamic one riding position is compared to another in order to maximize your speed for a given amount of effort you would normally use a wind tunnel.
Or you could use your power meter to get virtually the same results using the Aerolab feature in Golden Cheetah. (If you don’t have a power meter you can also use the Golden Cheetah program to estimate your power but this isn’t ideal).
Testing your position in this way is really important because it allows you to check how different positions affect your ability to deliver power in each position, something that can be badly affected by extreme riding positions.
An Aero position that reduces your power output is kind of defeating!
The first thing you need to do is to choose a test route and this should ideally be a loop so that you start and finish at the same point (Because then you KNOW the start and finish elevation is the same). You can also use existing ride data but this isn't ideal although it can be very interesting.
It’s OK, in fact, it’s recommended that the test route is hilly and the endpoint should be uphill so you can finish without using the brakes.
You need to have an accurate Power meter fitted to the bike (unless you are using GC to produce your estimated power chart) and a way to measure air density (See Bottom of Article) and speed accurately.
Here are a few more important points you need to take into consideration
- Test when there is very little wind and ideally none (Early morning is good)
- Make sure you can run the whole test without having to change position
- Make sure you don’t need to brake (this converts power to heat rather than forward motion)
- Make sure your position doesn’t compromise the amount of power you can transmit to the pedals
- Make sure there is as little traffic as possible, minimize drafting, passing or being passed
- The loop should be between 1Km and 5Kms long
Now go for a Ride! For each position ride multiple laps maintaining the same position and staying off your brakes, varying speed and power is a good thing and hitting speeds at or above your typical speeds is a good thing.
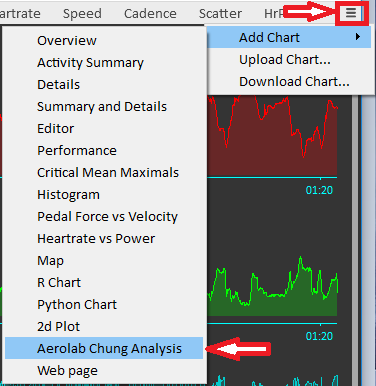
Save each run as a separate file and load them into Golden Cheetah, run the estimate power values program if you don’t have a power meter then open Aerolab by clicking the Hamburger Menu on the top right of the activities screen then add chart followed by Aerolab Chung Analysis.
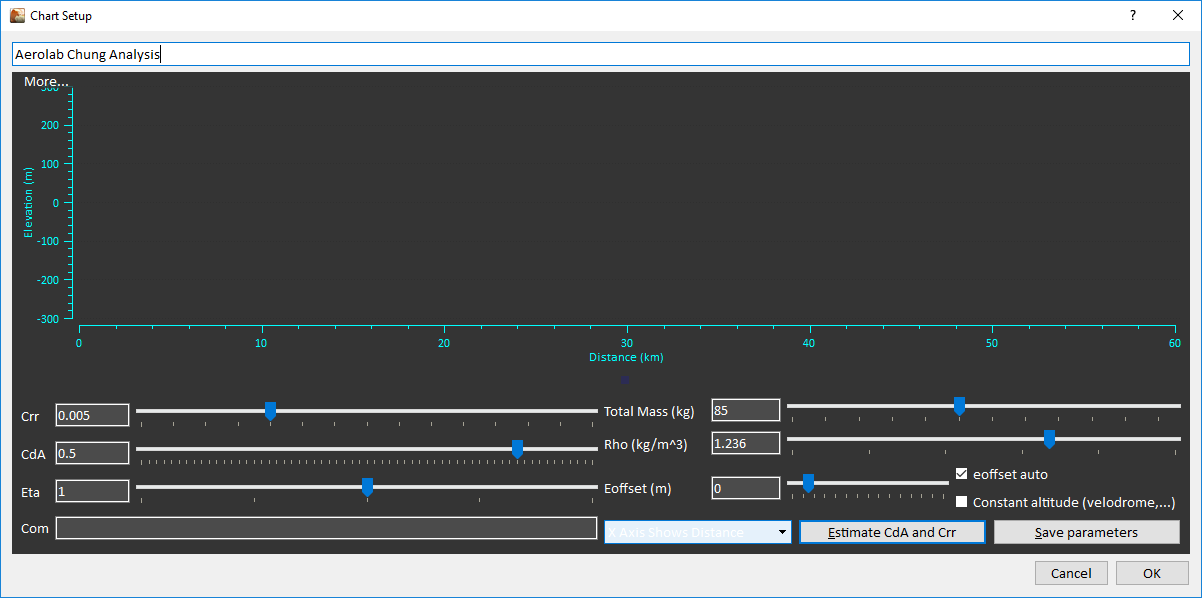
Now enter these values:
- Crr – Coefficient of Rolling resistance - If you don’t know the Crr of your tires, enter a value of 0.004 if you are using race tires or 0.005 for training tires leave this constant between tests.
- CdA – Aerodynamic drag – THE THING WE ARE LOOKING FOR LEAVE AS DEFAULT FOR NOW
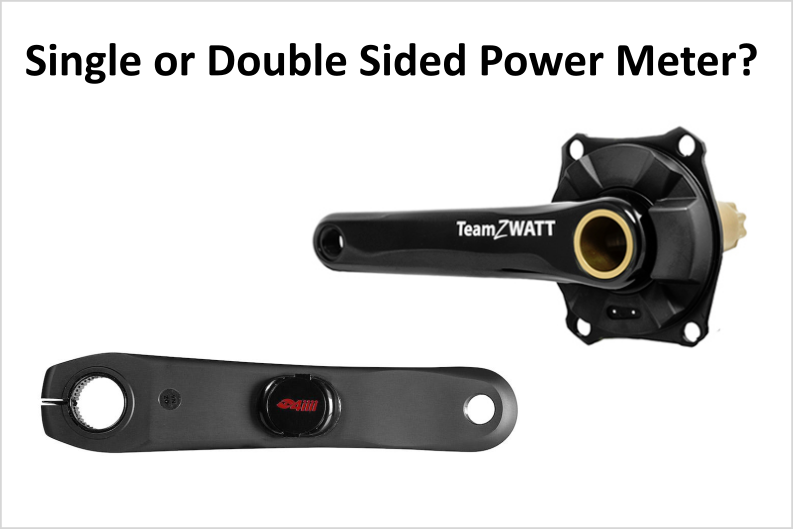
- Eta – Crank or hub-based power meter? Crank: use 0.98 for eta. Hub: use 1.0 for eta. Anything else use 1.0 for Eta
- Com - Comments
- Total Mass – Total weight of Rider, Bike and all equipment in Kg
- Rhi (kg/m^3) – Air Density Use GC air density calculator
- Eoffset - Elevation Offset - Elevation offset is just there to line up the 2 curves. Auto just puts the start of the 2 curves together. If you're riding loops back to a known position you can ignore the actual elevation line by checking the fixed elevation checkbox and then make sure the peaks and troughs line up with the flat line.
Having completed the Data you can now do the analysis
There are two lines
A Green line (Elevation) that represents the true elevation as measured by your bike computer or derived from GPS
A Blue line (Virtual Elevation) which is Aerolabs attempt to reconstruct your ride elevation profile by using guesses of your CdA and Crr through the use of Newton's Second Law.
Here’s an example of a ride I did recently using the raw data as loaded, we can use this to estimate my CdA by moving the CdA Slider (Changing the CdA guessed value) Until the real and Virtual elevations overlap
 Each time you move the CdA slider Aerolab makes another guess using the value just entered for CdA
 This is as good as I could get the overlap because this was just a random ride, rather than a test in controlled conditions but I got pretty close, once you are happy with the match the CdA value shown is your average aerodynamic drag for that ride.
If you have been doing loops then your line should look like a series of sine waves, one per lap. Variations in the shape and size of each wave are caused by things like gusts of wind, passing cars, and movement on the bike
 In this case, you can ignore the true elevation (The green line) and just move the CdA slider until you have lined up as many of the peaks and troughs as possible on an imaginary horizontal baseline (or check fixed elevation and line them up with that line.
Once you are happy with your match the correct value of CdA will be shown in the box
That's basically all you need to know to get started, If you want to learn more on the subject you can read the paper by Robert Chung here
How to Measure Air Density
Golden Cheetah has a useful air density calculator you need to enter the current Temperature, Air pressure and dewpoint which you can get from a web service like DarkSky or Wunderground but their accuracy depends on your distance from a weather station.
 A better solution might be to buy a portable weather station, they are very affordable and usually include and wind speed and direction which is very useful to know, here's a good example.

Leave A Comment
You must be logged in to post a comment.